Part 4 put group access control on the
gateway's admin UI and then, at the end, called the API from a shell with no account, no
session and no group. It answered normally. The conclusion was that SSO protects a control
plane and the data plane authenticates machine callers with keys — which it has to, because
an agent running at 3am cannot complete a browser login.
That was true and it was also a stopping point rather than an answer. "Machine callers use
keys" leaves you with a credential that never expires, that no identity provider knows about,
and that survives the person who created it. Part 4 said so plainly: removing someone from a
group does not revoke their keys, a leaked key is unaffected by identity entirely, and keys
outlive people.
This part gives the machine an identity instead of a key.
authentik issues the agent a token over the client credentials grant — no browser, no
consent screen, no human. The token is signed, carries a scope, and expires in five minutes.
The gateway verifies it locally against authentik's public keys and refuses anything without
the right scope. At the end, three status codes show the boundary holding.
Part 3 put authentik in front of Langfuse and
ended with an admission: the bindings step was left empty, so every account in authentik
could reach Langfuse and nothing would warn you.
This part closes that gap on the LiteLLM gateway
— and the closing went wrong in a way worth more than the procedure. We configured the
bindings in authentik's wizard, watched them appear in the wizard's own table, submitted,
and ended up with zero bindings saved. The application was open to everyone, the UI said
nothing, and the only reason we found out is that we tested with an account that should have
been refused and wasn't.
Then, once access control genuinely worked, we called the gateway's API from a shell with no
account, no session and no group. It answered normally. That one isn't a bug — it's the
difference between a control plane and a data plane, and assuming SSO covers both is
how people conclude they've secured something they haven't.
Part 4 built a callback that masks
PII in what the gateway logs without touching what the caller receives. It also noted
that the first working version used a blocking HTTP client inside an async def, and
that this cost 200-350ms across four sequential requests.
That post ended with an admission: four requests in a row is the wrong test. A blocked
event loop barely shows when nothing else is waiting. The damage should appear under
concurrency, and we had not measured it.
This is that measurement, and the result is a shape rather than a number. With the
blocking client, some batches take many times longer than they should. With the async
client, none do. The medians barely differ, which is exactly why this ships unnoticed.
Two things turned up that were not in the plan. The gateway does not merely slow down —
it drops requests. And when it does, the masking call is the thing that timed out,
while the caller still gets 200 OK. That means the guarantee Part 4 was built on
quietly stops holding under load.
A WEC Inference API key — create one in
the portal
httpx in your Python environment
Where these numbers came from
One WEC Instance: 8 vCPU AMD EPYC 7601, 15 GB RAM, Docker 29.1.3, kernel 5.15. LiteLLM
1.96.2 from ghcr.io/berriai/litellm:main-stable. Presidio analyzer and anonymizer as
local containers on the same host. Model Qwen2.5-3B-Instruct over the WEC Inference
API. Five repetitions per cell.
Latency numbers do not transfer between machines. Treat every second in this post as one
observation from that setup, not a figure to match. What should reproduce is the
difference between the two versions.
Everything here depends on one number, and it is not the number the documentation gives.
The LiteLLM proxy CLI has a --num_workers flag. The
published reference says its default is
"Number of logical CPUs in the system, or 4 if that cannot be determined." On an
eight-core box that would mean eight worker processes, eight event loops, and a blocking
call stalling one eighth of your traffic.
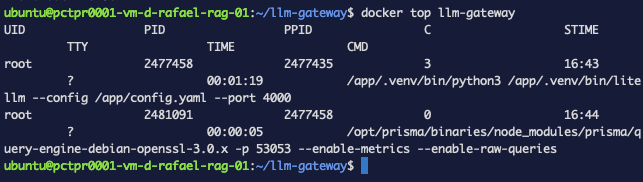
Ask the host what is actually running — from outside the container, so nothing inside it
can misreport:
  --num_workers INTEGER           Number of worker processes for uvicorn /
                                  gunicorn, or Granian worker processes
                                  (--workers). Default is 1 (from
                                  DEFAULT_NUM_WORKERS_LITELLM_PROXY). With
                                  --run_granian, use --granian_threads for
                                  runtime threads per worker.
Figure 3. The tool's own help text: "Default is 1."
That is a help string. Since we are about to contradict the published documentation, take
it from the source too — adjust the python version in the path to match your image:
The CLI reference states the --num_workers
default as "Number of logical CPUs in the system, or 4 if that cannot be determined."
Three sources say otherwise: the running container, the installed 1.96.2 source, and
current upstream main, where both the constant and the help string still say 1.
It is not a version skew, and it is not something in this deployment. Check yours:
dockerexec llm-gateway env|grep-i worker
Empty output means you are on the default, which is one worker.
So: one process, one event loop, shared by every request in flight. That is the condition
that turns a blocking call from a tax into an outage.
Fire N requests at once, time each, report the wall clock for the batch. The message
carries PII so the masking callback has real work to do. A failed request is counted
rather than allowed to abandon the run — you will need that.
~/llm-gateway/loadtest.py
"""Fire N chat completions at the gateway at once and report how long they take.
The message carries PII so the Presidio masking callback has real work to do.
A failed request is counted and reported, not allowed to abandon the batch.
Here is the trap. The gateway calls a model over the network. That model has its own
latency, its own load, and its own bad afternoons. When a batch takes twelve seconds you
cannot tell whether your gateway stalled or the upstream was busy — and if you guess, you
will publish nonsense.
So measure the upstream directly, with the gateway out of the path. Copy the file and
change the three constants at the top:
Three details in there are not decoration, and each one cost a wasted run to learn:
It waits for the gateway. A docker compose restart can take longer than ten
seconds, and firing at a port that is not listening yet produces instant failures —
gateway=0.03s(8 failed) — that look like a catastrophic result and mean nothing.
It refuses to take a label from you. It reads the loaded callback out of the
gateway's log. Pass blocking on the command line while the async callback is loaded and
you will measure the same code twice, see no difference, and conclude there is nothing
here. That happened twice while writing this.
It throws away a warm-up pass. The first batch after a restart pays for imports and
connection pools, and comes in three to six times slower than the next one regardless of
which callback is loaded.
You are about to compare two versions of one file, and you need certainty about which is
live. LiteLLM's startup log lists success and failure callbacks but not
litellm_settings.callbacks, and there is no endpoint that reports them —
/get/config/callbacks answers 200 with {"detail":"Not Found"}.
So have each version say its own name at import, where it costs nothing per request:
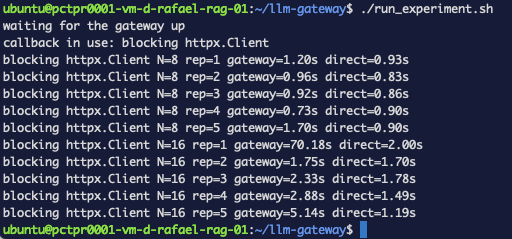
Figure 7. The blocking client. Same script, same load, one word different in the
code. The control column holds at 1.19-2.00s throughout.
Version
N
Gateway median
Gateway worst
Control median
async AsyncClient
8
0.90s
0.98s
0.85s
async AsyncClient
16
1.61s
1.77s
1.42s
blocking Client
8
0.96s
1.70s
0.90s
blocking Client
16
2.88s
70.18s *
1.70s
Figure 8. Every batch from Figures 6 and 7 on a log axis. The control stays inside a
narrow band in all four groups. The async runs stay with it. Two blocking runs leave it.
One number in that table needs an asterisk
The 70.18s batch overlapped an unrelated load test running against the same gateway, so
part of it is not attributable to the callback. It is reported because it happened, not
because it is clean. Read the 5.14s batch as the representative stall — still more than
four times its own control of 1.19s.
The effect itself reproduced across four separate runs on this host, with N=16 stalls of
11.22s, 12.44s, 21.22s, 31.14s and 5.14s. Across every clean async run: none.
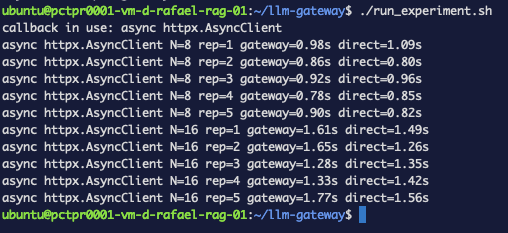
Read the async rows first. At N=8 the gateway's median is 0.90s and the control's is
0.85s. The callback, Presidio round trips and all, disappears into the model's own
latency.
Now the blocking row at N=8. Median 0.96s against a 0.90s control. That is 0.06s. If you
measured medians and shipped, you would call it fine — and the worst batch in the same
five took 1.70s while its own control took 0.90s.
At N=16 it stops hiding. The median goes to 2.88s against 1.70s, and the tail runs off
the chart.
Skill unlocked 🏅
You can tell whether a slow gateway is your own code or the model it calls — run the same
load against both, interleaved, and read the tail instead of the median.
INFO: 172.22.0.1:47566 - "POST /v1/chat/completions HTTP/1.1" 200 OK
--
httpx.ReadTimeout: timed out
INFO: 172.22.0.1:52870 - "POST /v1/chat/completions HTTP/1.1" 200 OK
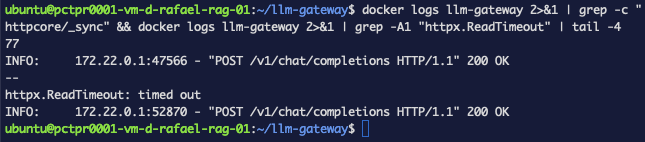
Figure 9.httpcore/_sync appears 77 times. The async client would produce
_async. And the timeout sits between two 200 OK lines.
That _sync is the fingerprint. It proves the failing call is the blocking Presidio call
and not something else in the stack. The full error names the caller:
LiteLLM:ERROR: logging_worker.py:103 - LoggingWorker error: timed out
  File ".../httpcore/_sync/connection_pool.py", line 236, in handle_request
  httpcore.ReadTimeout: timed out
Now look at what surrounds it.200 OK. The requests succeeded. The masking is what
failed.
That is the part worth stopping on, because Part 4's whole promise was that PII reaches
your traces already masked. Under load, with the blocking client, the masking call times
out against its own ten-second limit while the caller receives a normal success. Nothing
in the response tells you the guarantee lapsed. You would have to be reading the
gateway's stderr to know.
httpx.Client inside an async def does not yield. When the callback calls Presidio, the
thread running the event loop sits in a socket read until Presidio answers, and during
that time the loop services nothing — not another request's model call, not a response
coming back. It is one loop, as you confirmed at the start.
Each request triggers several of these calls: the messages, the copy in the standard
logging object, and the response. So under concurrency the requests do not overlap. They
queue, and each one's wait is every earlier one's Presidio time added together. That is
why the effect is not a constant tax — it depends on how many requests happen to arrive
while the loop is held, which is also why the numbers are spiky rather than uniformly
worse.
Past a certain queue depth the waits exceed the scrubber's own timeout=10.0 and the
masking gives up, while client connections waiting on a frozen loop get dropped. The
median hides all of it because most batches get lucky. The tail is the truth.
The fix is the one Part 4 landed on, and this is the evidence for it: httpx.AsyncClient
with await, which yields the loop while Presidio works.
diff scrubber.py scrubber_blocking.py
Output
26,27c26,27
<     async with httpx.AsyncClient(timeout=10.0) as client:
<         r = await client.post(f"{ANALYZER}/analyze", json={"text": text, "language": "en"})
---
>     with httpx.Client(timeout=10.0) as client:
>         r = client.post(f"{ANALYZER}/analyze", json={"text": text, "language": "en"})
Two words and an await. That is the whole difference between Figure 6 and Figure 7.
More workers is not the fix, and the documentation explains why better than we could. On
--timeout_worker_healthcheck, describing --num_workers > 1:
"the supervisor process pings each worker; a worker that does not respond within this
window (for example because its event loop is blocked by synchronous work) is killed
with SIGKILL and replaced."
At one worker there is no supervisor, so a blocked loop stalls. At several, a blocked
worker gets killed and everything in flight on it dies instead of waiting. Neither is a
fix for synchronous work on an event loop. Fix the call.
🎯
Finished this tutorial?
Mark it complete to earn Prove it holds under load on your skill path.
Five reps per cell is enough to show that a stall exists next to a steady control. It is
not enough to characterise the distribution — how often, how bad, or how it scales past
N=16. If you run this in production, run it longer and look at percentiles.
We did not test --num_workers > 1, streaming responses, or a slow or remote Presidio
rather than a healthy local container.
The obvious worry, when the masking call times out on a request that returned 200 OK,
is that the unmasked payload lands in the trace anyway. It does not.
Sustained load — six rounds of twenty-four concurrent requests, each carrying a name and
a phone number — produced 77 masking timeouts in the gateway log. Of the 144
requests, 62 traces reached Langfuse and 82 never arrived at all. Every one of the 62
was properly masked. None carried a raw name.
So the failure is not a privacy failure. It is an observability failure, and a quiet one:
under sustained load more than half the traffic simply is not recorded, while every
caller gets a normal success. If you are reading trace volume as a proxy for traffic, or
counting on traces for an audit trail, that gap is the thing to watch — and it is
invisible from the response side.
Measure detection before you measure anything else
Building this test, requests were tagged with a short marker so each trace could be found
— [TAG-07] Priya Raghunathan called from …. Nine traces then came back with the phone
masked and the name in the clear, which reads exactly like a load-induced leak.
It was not. Sequentially, with no load at all, that sentence sent straight to Presidio
returns only PHONE_NUMBER; the same sentence without the bracketed prefix returns
PERSON and PHONE_NUMBER both. The marker suppressed name detection, and the callback
faithfully masked everything Presidio reported.
Check what your analyzer detects in your exact strings before concluding anything about
masking under load. An instrument that changes the thing it measures will hand you a
finding that is not there.
Part 3 configured Presidio to mask
prompts at logging time and deliberately stopped short of proving it. Nothing had
been wired to a logging destination yet, so there was no trace to inspect.
This post wires one up, finds <PERSON> where it should be — and then finds the
customer's real email address sitting a few lines below it, in the model's reply.
Part 2 ended with the gateway deciding
which model answers each request — and still forwarding every prompt verbatim,
including the ones carrying customer names, emails and phone numbers.
This post puts a PII filter in that path. Not in front of the model, though:
in front of the logs. The model reading
your prompt is doing its job; the risk is what gets stored. So the raw text
goes to the model and a masked copy goes to your logging.
That is what the gateway advertises. Following its documented configuration got
me the opposite — a model that answered correctly and a reply that came back as
<LOCATION>. This is how to find that and how to fix it.
Part 1 ended on an uncomfortable
number. The same three-word answer cost 3 tokens from a small model and 200 from
a reasoning model — which spent all 200 thinking and returned nothing at all.
Every request your apps send picks a model, and mostly that choice is made once,
hardcoded, and never revisited. This post puts the gateway in charge of it
instead: classify the request, route it to a model sized for the work. Then it
measures what that decision costs, because it is not free and most write-ups
skip that part.
Here's how it usually goes. One app needs a model, so you paste the API key into
its .env. Then a second app needs one. Then a script. Six months later the same
key is in five places, nobody remembers which of them is still running, and you
can't rotate it without breaking something you'll only find out about when it
breaks.
A gateway is the boring fix. One endpoint in front of every model, one place that
holds the real credential, and a scoped key per app that you can revoke on its own.
This post deploys one on a WEC Instance and points it at the WEC Inference API.

 +
+